PDF Download (Paid Subscription Required): The Epsilon Strategy
Back in the day, the long/short hedge fund I co-managed was part of a larger long-only asset manager. Their biggest strategy was US mid-cap value, and it was well staffed with a bevy of really sharp analysts and PMs. But the firm also had a $4 billion US large-cap strategy that was managed by all of two people – the firm’s co-founder as PM, plus a single analyst position that was something of a revolving door … people would come and go all the time in that seat.
The solo analyst’s job, as far as I could tell, was basically to go to investor conferences and to construct massive spreadsheets for calculating discounted cash flow models for, like, Google. And sure, Google would be in the portfolio, because Google MUST be in a large-cap portfolio, but it had nothing to do with the literally hundreds of hours that were embedded in this sixty page spreadsheet. I mean … if the firm’s co-founder/PM spoke with the analyst more than once per week about anything, it was an unusual week, and there’s zero chance that he ever went through this or any other spreadsheet. Zero.
Now to be clear, I think the firm’s co-founder was a brilliant investor. This guy GOT IT … both in terms of the performance of portfolio management and the business of asset management. But here he was, managing a $4 billion portfolio with one ignored analyst, and it was working just fine. So I was talking with him one day and finally asked the question: what are you doing with large-cap?
Here’s his answer, and it has stuck with me like glue ever since.
Look, Ben, you gotta understand. Large-cap investing … it isn’t stock-picking. I gotta have the research and I gotta be able to talk about the names, because that’s what’s in the portfolio. But it isn’t stock-picking. You will drive yourself craaaazy if you’re picking large-caps, and it doesn’t do anything for you. Large-cap investing is sector-picking. What matters is whether I’m overweight or underweight a sector versus the benchmark. That’s the ONLY thing that matters.
So I asked the obvious follow-up: how do you do THAT? how do you pick sectors?
Money flows. I talk to guys about what they’re seeing. And then there are guys like Birinyi who publish books of data on this stuff every month. You can’t catch the little moves, but every now and then you can catch a big move into or out of a sector. And that’s all it takes.
He showed me some of the Laszlo Birinyi journals. They were Kabbalah-esque to put it mildly, printed page after printed page after printed page of tickers and numbers and arrows.
But I got it.
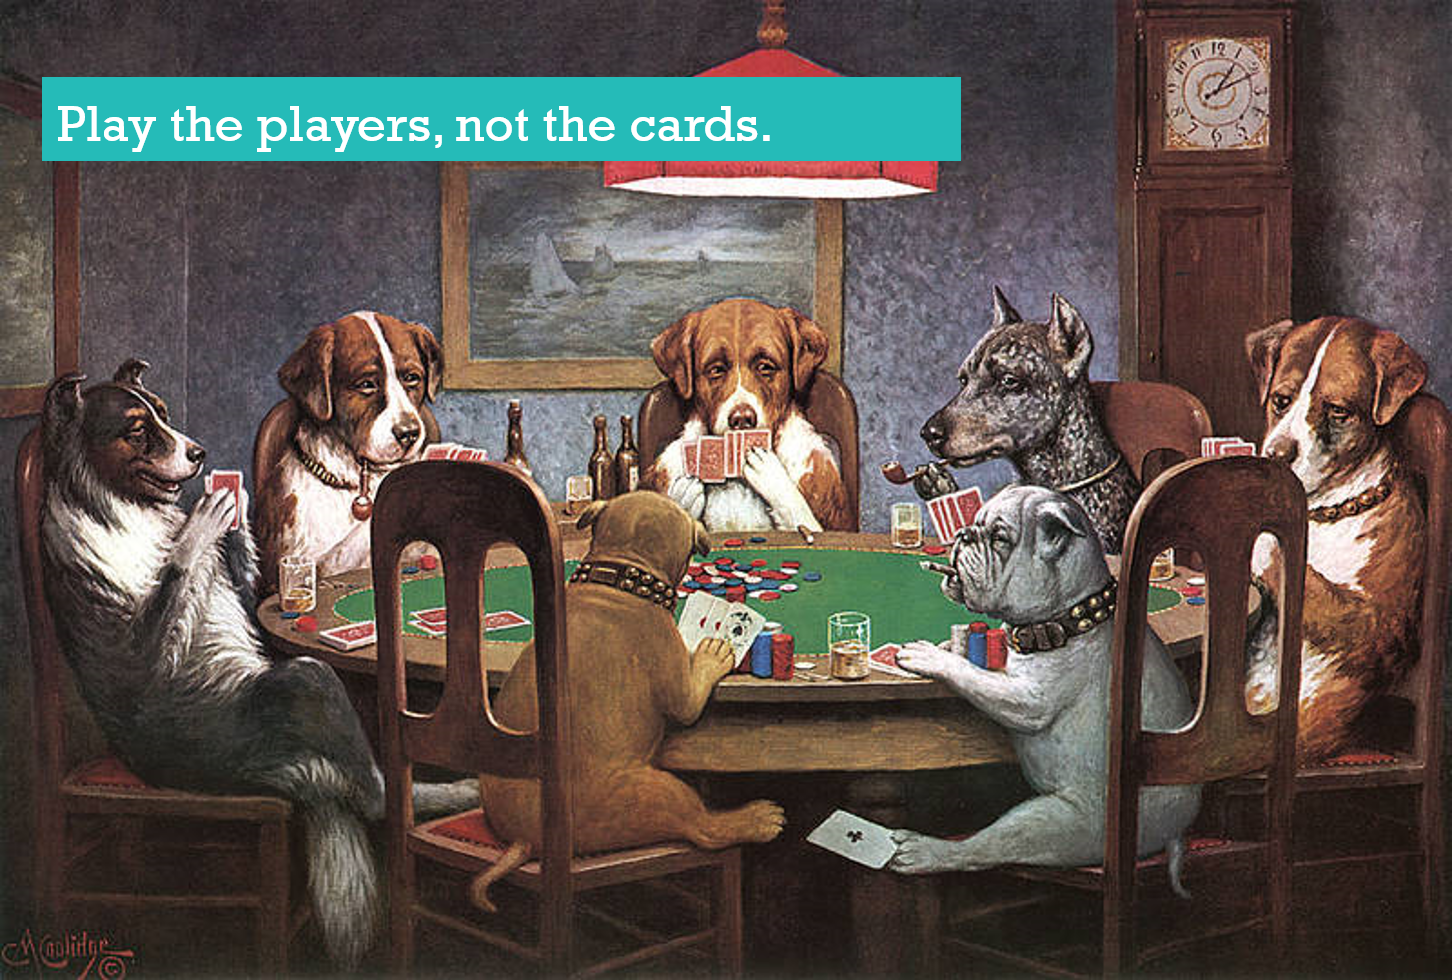
He wasn’t just playing the cards. He was playing the players.
He was reading the tape.
Now I know this will come as a shock to almost every active investor today, but reading the tape – trying to figure out the flow of money into and out of securities – was THE dominant approach to investment strategies at least through the 1960s.
Intrinsic security analysis? Graham and Dodd? The wit and wisdom of Uncle Warren and the hajj to Omaha? All of these beliefs and tenets that we hold so dear as received truths in this, the best of all possible worlds? Pffft. Sixty years ago you would have been laughed off of Wall Street.
What, you think we’re smarter than those guys sixty years ago? You think we’ve made some sort of scientific advancement that changes the social nature of markets? LOL
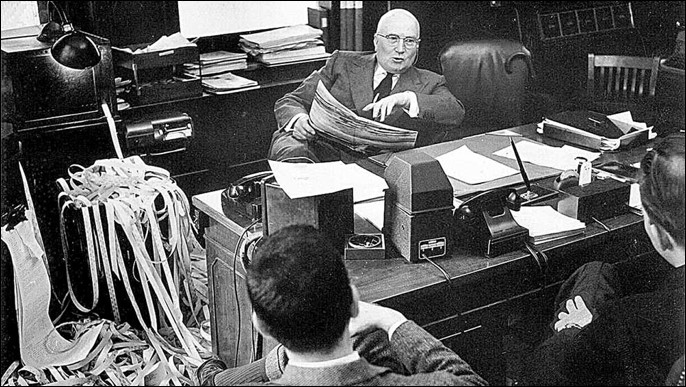
To a guy like Gerald Loeb, who co-founded E.F. Hutton and was Warren Buffett-level famous back in his day, intrinsic value analysis of a security wasn’t just wrong-headed, it was downright destructive to wealth creation. Only the rubes thought they knew better than the market what a stock was worth, and during the Great Depression he saw these “value investors” carted off the field by the thousands.
What’s a stock worth? Whatever the next guy is willing to pay for it, that’s what. Nothing more and nothing less. Intrinsic security analysis … gimme a break.
That’s the Wall Street gospel of Gerald Loeb. In the 1950s, everyone knew that everyone knew that Gerald Loeb was right.
No one remembers Gerald Loeb today.
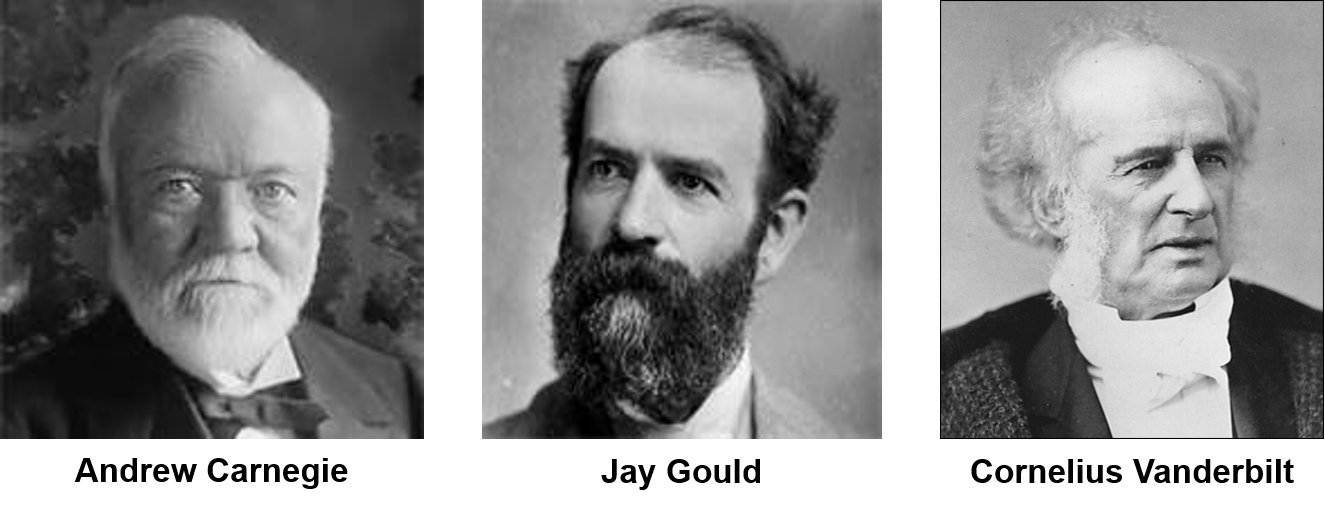
It was the same with Carnegie and Gould and Vanderbilt and all of the other robber baron OGs of Wall Street. Read their memoirs, or the memoirs of the poor saps who “invested” against them … robber barons didn’t build DCF models! They figured out corners. They read the tape and they made the tape. They figured out where the money was flowing and how to get it to flow where they wanted it to flow.
All of these guys must be spinning in their graves to see what we’ve become – a nation of rubes, bowing and scraping to the Great God of Intrinsic Value Analysis, buying high and selling low constantly, in both politics and investing, for no reason other than we are TOLD that this is the Truth with a capital T here in Fiat World.
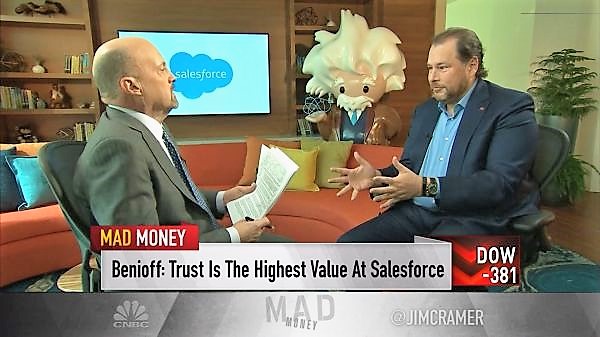
Marc Benioff gets it. Jim Cramer gets it. They have figured out the game. Why can’t we?
Because we’re really bad poker players, that’s why.
We stare at the cards in front of us and we bet them as if no one in the history of the world has ever been dealt those cards before. We bet them with zero strategic consideration of the larger metagame that we’re playing … the game of markets. We bet them as if everything we hear and see from the other players around the table, particularly the players with really big stacks, is the straightforward truth, as if their finger-wagging and Fiat News – the presentation of opinion as fact – were some sort of neutral act, some sort of public good, rather than the intentional self-aggrandizing act of people who want to take our chips away from us.
We can be better poker players.
Not by putting another 100 hours of work into our DCF spreadsheet for Google. Not by doing more “fundamental analysis” on Salesforce.com, where … don’t forget! … Trust Is The Highest Value ™.
We can’t be better poker players by playing the cards any harder.
We CAN be better poker players by playing the players a lot smarter.
We can be better poker players by applying a new technology – Natural Language Processing (NLP) – to an old idea – reading the tape.
We can be better poker players by anticipating money flow behaviors through a mathematical calculation of the Narrative effort that Wall Street makes to TELL you what sectors to buy and TELL you what sectors to sell.

Just like Teddy KGB and his Oreos, Wall Street can’t help itself but signal its intentions.
This is Wall Street’s literal tell.
I know … crazy talk. Pics or it didn’t happen, right? Fair enough.
For a couple of years now, Epsilon Theory has been presenting two-dimensional representations of networks of financial media texts, what we call narrative maps. We’ve been using an NLP AI and data visualization software package developed by Quid (which is a very cool company you should check out) to process and represent the textual data. Here is Quid’s one-slide primer on what you’re looking at when you see one of these narrative maps.

I find it helpful to think of the Quid software as a microscope, as a lab instrument that we can license. It’s up to us what we DO with that microscope – how we choose something appropriate to analyze, how we prepare the “slides”, and how we interpret the results.
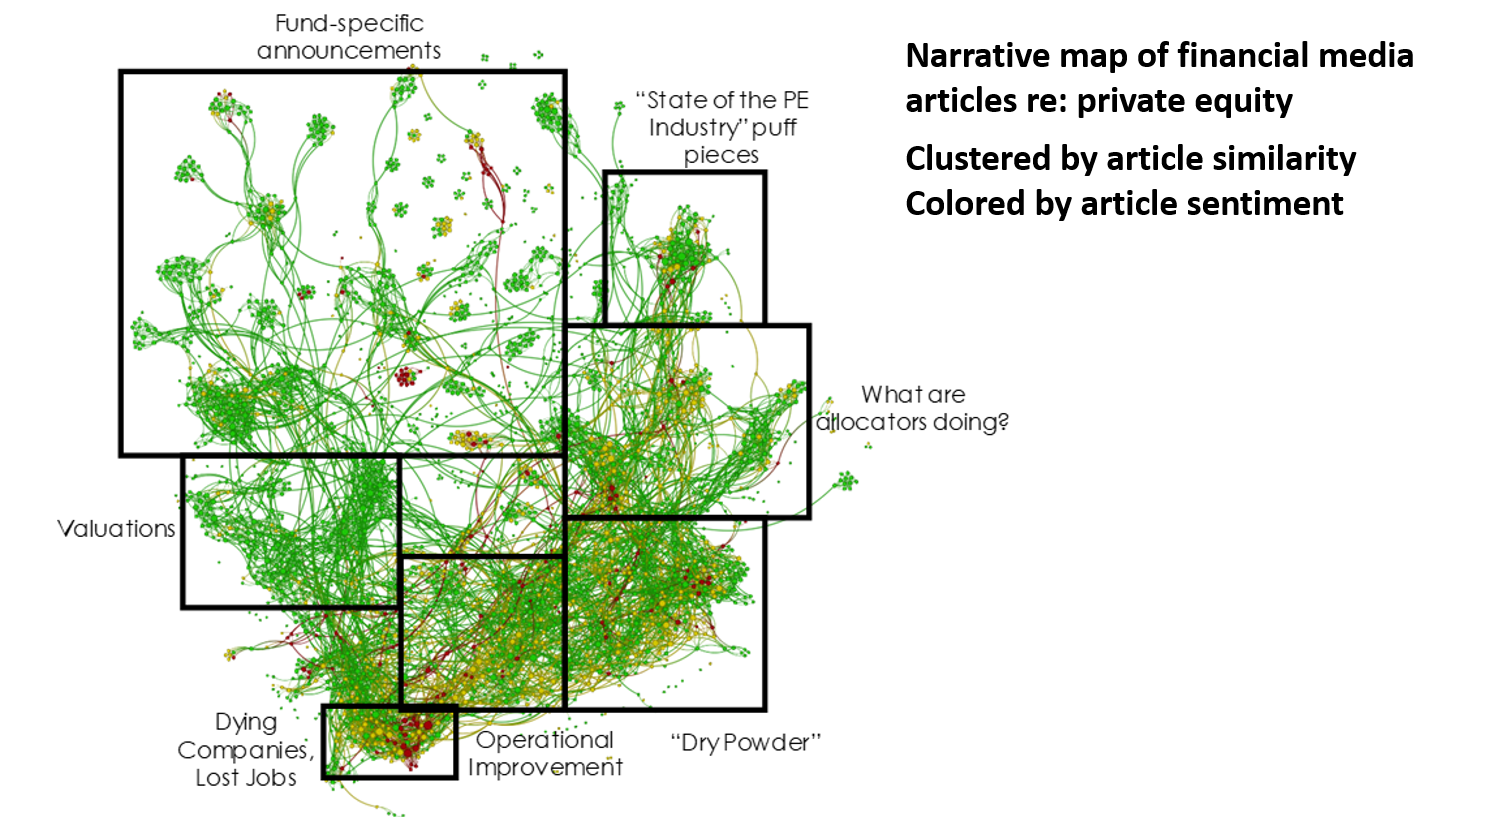
Here, for example, is a narrative map of financial media articles that contained the search term “private equity” over the prior six months, where each of the individual dots (nodes) represent a single unique article, where the nodes are clustered by language similarities, and where the nodes are colored by the overall sentiment score of each article.
And here is the narrative map of financial media articles over the same time span that contained the search term “hedge fund”.
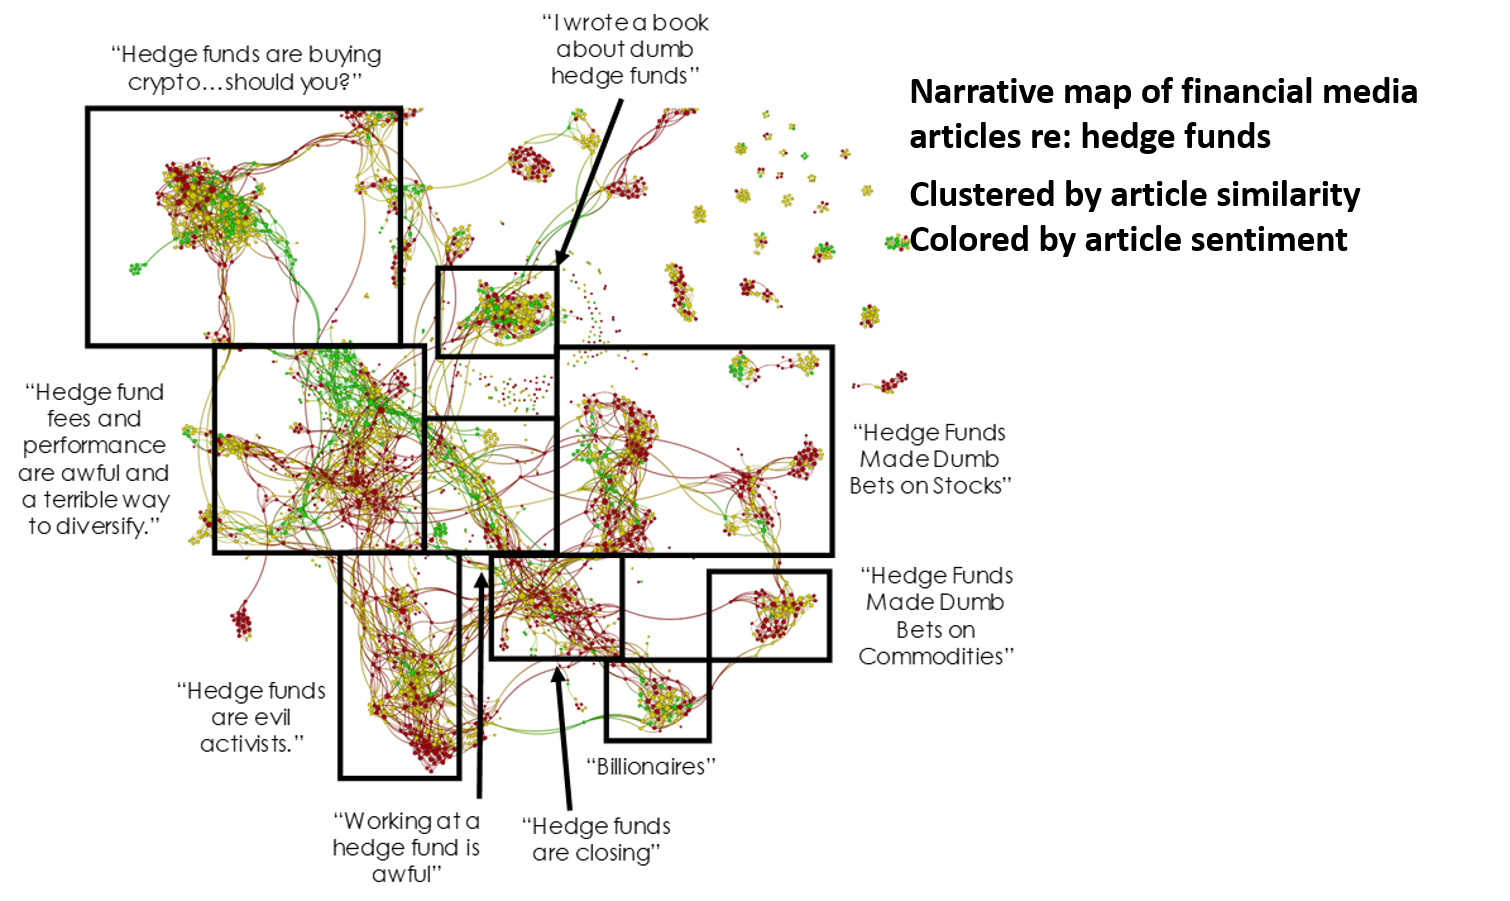
What do the differences in the two narrative maps mean? A lot. We think. That is, so long as we are looking at these two-dimensional narrative maps and interpreting their differences in size and shape and coloring, we’re giving you our qualitative assessment of those differences. It’s what we THINK, not what we MEASURE, and unless the differences are pretty stark it can be difficult for the human eye to make out a meaningful difference.
Also – and this is really important – these two-dimensional visualizations of a narrative map are by necessity compressing the hell out of the underlying data. We are losing information in the creation of this visualization, and we have to get down to the level of the underlying data matrix in order to use ALL of the data and apply MATH to it.
To get a sense of the underlying data matrix and what information we can pull from it, we have to go back to what the AI of any Natural Language Processing (NLP) technology is actually doing. An NLP AI has been trained on millions of text documents in order to recognize syntax and n-grams (words and phrases with discrete meaning) across a symbolic set (a language), and it compares every n-gram in one text document with every n-gram in every other text document to create a truly massive set of n-gram comparisons, mapped to each document.
Say you’ve got 1,000 documents, each with 1,000 n-grams. One document of 1,000 n-grams processed against one other document of 1,000 n-grams generates 1 million n-gram comparisons. One document processed against all other documents generates (almost) 1 billion n-gram comparisons. Every document processed against every other document generates (almost) half a trillion n-gram comparisons. That’s a big number, and that’s why NLP has really only come into its own over the past four or five years … the data calculations themselves are pretty trivial, but you need a ton of sheer computing processing power to complete these tasks in a non-trivial amount of time.
Now let’s organize those n-gram comparisons at the node (document) level, so that we create a matrix of each node compared to every other node, with an asymmetric dimensional depth derived from the shared n-grams associated with each node-to-node comparison. This is a matrix with millions of node-compared/n-gram-shared relationships.
Now imagine the pattern of those relationships. In particular, imagine the distance between these node relationships. Because that’s all the math IS in these matrix algebra calculations … different ways of measuring the distance and the centrality of one dynamic node-and-n-gram relationship to another.
I know … still kinda ethereal and hard to wrap your head around.
The important thing to remember is that this is a big data matrix of relationships or connections between nodes. That’s the THING that we want to analyze with matrix algebra.
We want to measure two aspects of this patterning of node relationships: Attention and Cohesion.
(I’ll show examples of both in two-dimensional space, but keep in the back of your mind that what we’re doing now is applying these two dimensional visualizations onto a multi-dimensional data matrix, because math isn’t forced into seeing in only two or three dimensions like we are.)
Attention is the persistence or prevalence of one narrative sub-structure relative to all the other narrative sub-structures within a broader narrative structure.
In English, it’s a measure of how much financial media drum-beating is happening on, say, “China Tariffs” relative to all of the other financial media drum-beating that’s happening over any given time span.
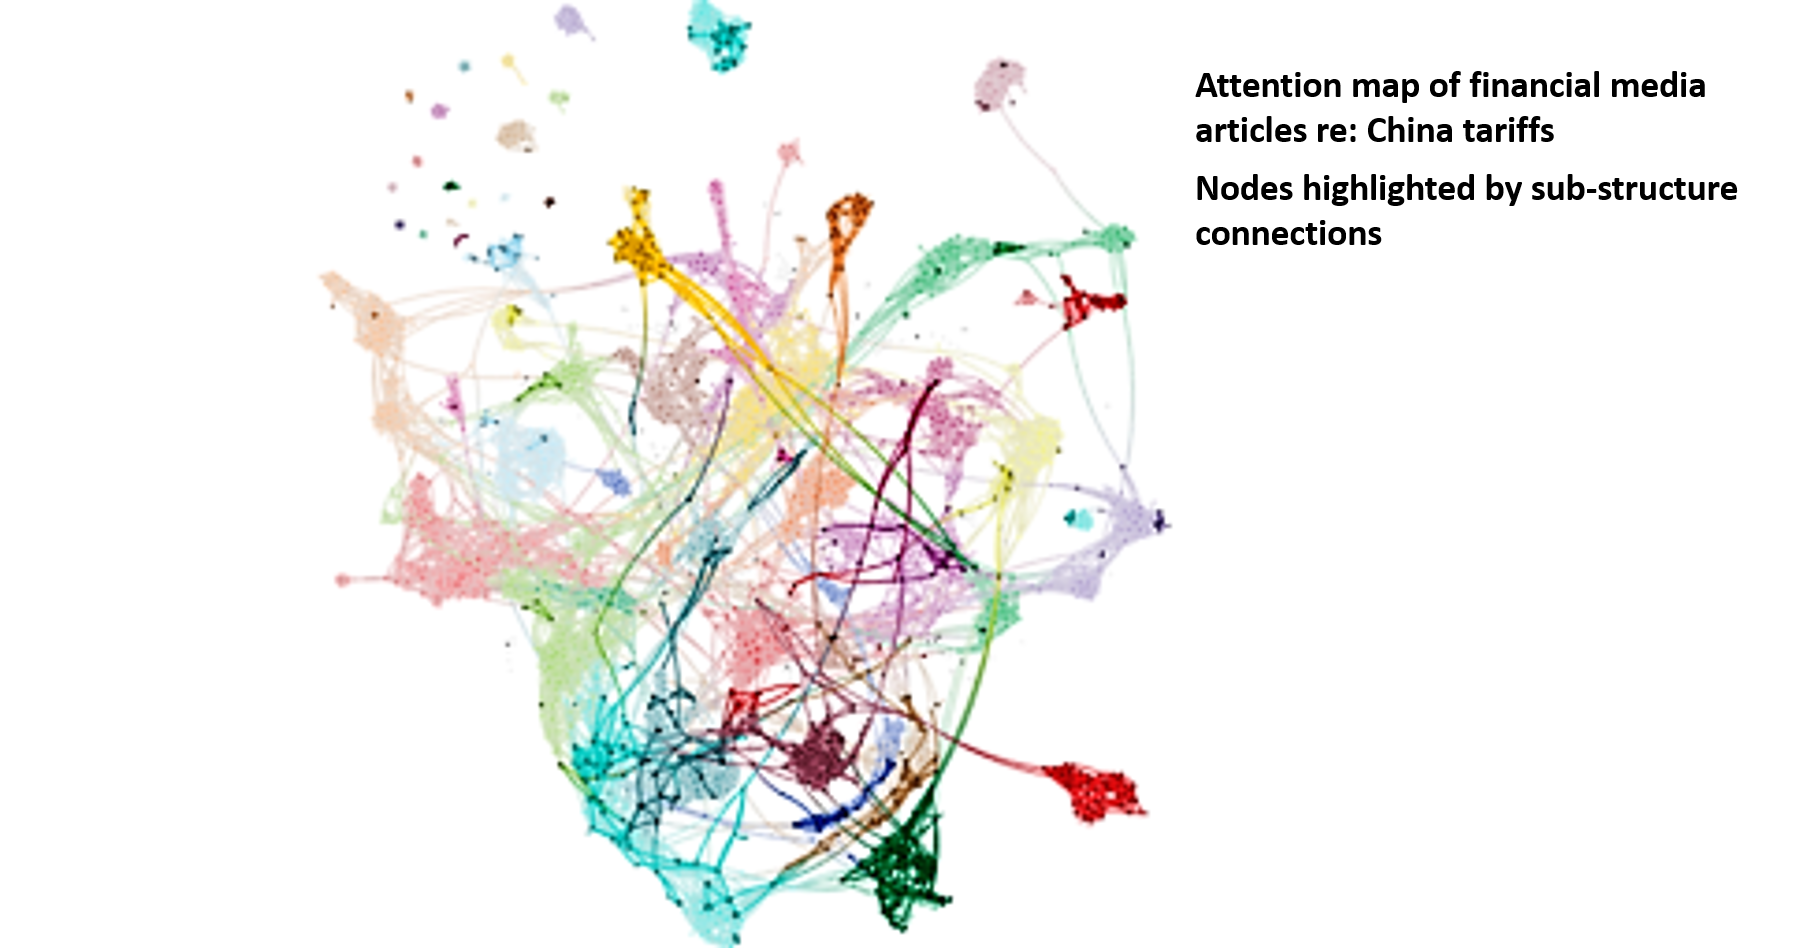
This isn’t a narrative map of “China Tariffs” in February. This is a narrative map of ALL financial media in February. Nor is it a map where we have just highlighted the specific “China Tariffs” cluster of nodes, because that single cluster is a product of “flattening” the underlying multi-dimensional data matrix into a two-dimensional representation of the most prominent data relationships. This is a map of ALL financial media in February, where we have highlighted ALL of the nodes that possess a relevant n-gram connection to the narrative sub-structure of “China Tariffs”.
If you’re familiar with microscopy or medical imagery, the methodology here is similar to “staining” cells that possess some particular biological marker, regardless of where those cells live in the body or are clustered on the slide. In a very real sense, whatever narrative we’re interested in studying is like a cancer, and we’re trying to measure its metastasis over time.
Cohesion is the connectedness and similarity of language within a narrative map, relative to itself over time.
In English, it’s a measure of how focused financial media drum-beating is on, say, “Inflation” or “Brexit” over time. It’s a measure of shared meaning and centrality of meaning within a given topic. For example, both of the maps on the right are far more cohesive than their cousins on the left:
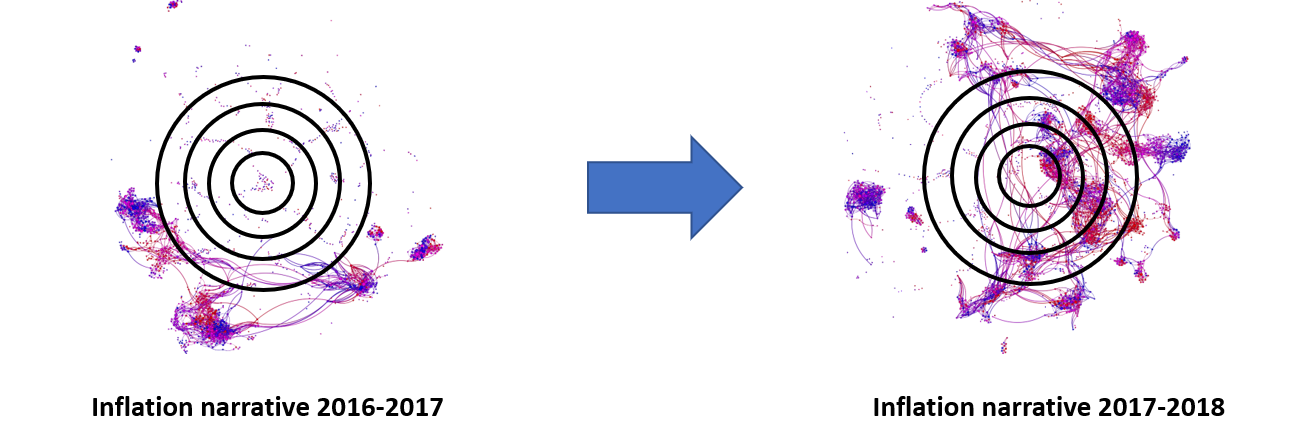

I like to think of Cohesion as a measure of the average node’s distance from the center of gravity of the overall map. It’s the difference between people writing about inflation or Brexit as a throwaway line, as something tangential to what they’re really writing about, and really writing ABOUT inflation or Brexit.
So notice what we haven’t talked about at all in this discussion of how to measure narrative. We haven’t talked one bit about Sentiment, even though that’s the only meaning most people have for the concept of narrative!
If you think you’re analyzing narratives by measuring Sentiment, you’re doing it wrong.
Why? Because Sentiment is a property of each individual node. It has nothing to do with the relationships or connections between nodes. Sentiment is a conditioner of narrative, not a structural component of narrative.
Sentiment is measured by comparing the n-grams in any given text document to a lexicon of n-grams that have been pre-scored for their level of sentimental affect. Not only does that create some weirdnesses based on how that lexicon was constructed and scored (for example, most lexicons would score “overweight” as a highly negative n-gram, even though it’s a highly positive n-gram in financial media), but more importantly there’s no comparison of one document to another. Sentiment is just a standalone score for that particular document. You can roll that up for the average sentiment of the narrative map, but taken by itself Sentiment is always going to treat each node as equally important, regardless of its relevance for the Attention and Cohesion of the narrative.
Is Sentiment an important measure? Sure. But it only has actionable meaning (we think) in connection with a structural component of narrative, like Attention or Cohesion. Bottom line: Sentiment colors narrative (literally in our maps), but it is not narrative itself.
Are there other aspects of n-grams that color narrative but are not narrative themselves? Yes. In particular, we think that there is a fiat-ness to word choice, particularly in financial and political media, where authors intentionally choose one set of words over another set of words in order to couch their opinions as fact. It’s what we’ve called Fiat News, and we’re developing our own lexicon for this conditioner of narrative.
So that’s how we measure market narratives in a rigorous way.
Now we have to connect those measures to a theory of money flows.
It’s a pretty basic connection, really, and it’s at the core of all advertising … actually, all marketing since the dawn of time: we don’t buy what we don’t notice.
This is as true for large-cap stocks as it is for soap or cornflakes, and Wall Street knows it. The way to anticipate money flows is to track the effort that the Street makes to get you to notice this sector or that sector. That effort is what we call narrative, and the greater the effort, the more we notice. The more we notice, the more likely we are to buy, particularly if that effort is coupled with a focused pitch and a positive slant.
By tracking narrative effort, focus and slant – or what we call Attention, Cohesion and Sentiment – we think we can anticipate money flows. We think that different combinations of higher or lower than usual Attention, Cohesion and Sentiment create different pressures on future money flows. Which means different pressures on future prices.
We’ve theorized four basic combinations – what we’ll call Narrative Regimes – that we think create pressure on future money flows. No doubt there are others.
Early Drumbeats: Low Attention + High Sentiment
Wavering Bull: Low Cohesion + High Sentiment
Cohesive Bear: High Cohesion + Low Sentiment
Overbought: High Attention
And we think they work like this:
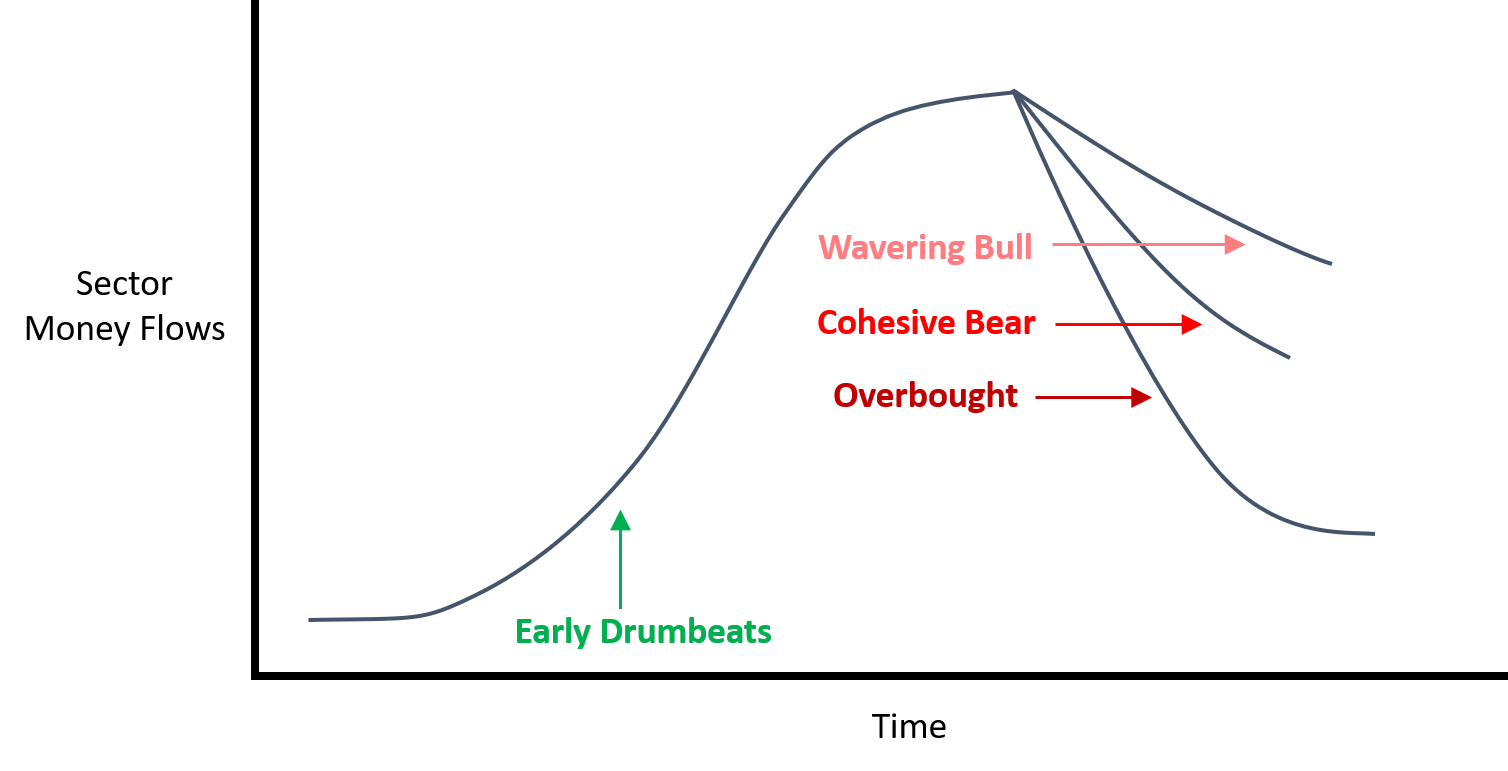
There is a lifecycle to any market narrative.
It is born, it grows, maybe it reproduces, and it dies.
The birth of a market narrative often takes the form of Early Drumbeats. Here the Attention score is low but the Sentiment is high. The Street must try out different arguments, different stories before they can find one that sticks. But they WILL find the one that sticks, and the result is investor attention. Investors notice the sector. Investors hear the marketing effort. And investors buy. Can you measure Early Drumbeats in time T? Then own the sector in time T+1, because that’s when the money really flows in.
All good things come to an end. Maybe the Street is so successful in creating a compelling market narrative that Attention gets unusually high (Overbought). Measure that in time T? You’ll want to short that sector in time T+1. Or maybe the market narrative loses its focus while keeping a positive slant (Wavering Bull). That’s how a narrative slowly dies. Or maybe the market narrative keeps its focus but sours on the sector (Cohesive Bear). That happens more often than you think, particularly after a long period of positive drum-beating that didn’t particularly go anywhere. You’ll see selling when this narrative regime takes hold, too.
For the past few months we’ve been running processors and threads 24/7 to calculate Attention, Cohesion and Sentiment scores for the eleven sectors of the S&P 500 so that we can test these narrative theories of money flows. That’s an enormous amount of computational analysis and it’s gotten us … 24 months worth of data so far.
I honestly do not know where this will all end up.
I honestly do not know how to tell you about our preliminary results without TELLING YOU A STORY about our preliminary results, because that’s what preliminary results are … a story. And if you’ve followed Epsilon Theory even a little bit you’ll know what I mean when I say that’s a mighty poor way to play this metagame.
So I’m not going to talk about results until I can do it without telling a story, until I can show you results that speak for themselves. It’s like the difference between qualitatively interpreted narrative maps and algebraic calculations on the underlying data matrix … the difference between what we THINK and what we can MEASURE.
But I will continue to talk about our research program, rarely in the clear with notes like this, but openly and fully with our Epsilon Theory Professional subscribers.
If you’d like a front row seat for this research program, as we try to reanimate an old investment strategy with a new technology, please consider an ET Pro subscription. We really don’t know where this will all end up. But it will be one hell of a ride.
PDF Download (Paid Subscription Required): The Epsilon Strategy


This reminds me of a story an old London currency trader friend told me about working in the 80s and 90s. There were fewer computers thus less ‘anlysis’ and more gut feeling. One guy, the most successful trader on the floor, ignored virtually all the financial media but always carried a copy of the Sun with him. It ‘told’ him what the mood was that day and he’d trade on that. A bit like reading the tape but at a more meta level.
I should also ask if you think there’s anything that Foucault or those old Euro Marxists could tell us about markets and narrative. My gut feeling - and as I get older I realise that gut sometimes needs to be believed - tells me there’s something in there that’s worth studying. Certainly better value I’m sure than the CFA textbook. I say this as a former fundamentally-trained equity analyst at a long-only value fund who hardly ever used value indicators or models in his personal account.
I just saw this video today of neurons making connections, and I’m struck by the visual and metaphorical similarity to your narrative maps. https://www.youtube.com/watch?v=hb7tjqhfDus
It’s EXACTLY the same thing.
I am Baudrillard. Just in convenient English language form.
I’m guessing you can do full backwards-testing with Quid, where you can, say, examine the narrative that existed before significant market moves in a stock? That sounds pretty useful…
What exactly is the “causal” latency between the attention/cohesion/sentiment and actual money flows? I’m not sure how one would determine what the “+1” in time “T+1”. Some work with PCA maybe? I suppose that it could vary in relation to volatility and trading time.
It seems like it would be something hard to do without trying to extrapolate what is the shape of the straw that will break the camel’s back.
The Narrative Machine is a low-resolution camera right now. More like the early iPhone than a Galaxy S10. So we’re taking very simple implementations here on the sector rotation strategies, like monthly snapshots and rebalancing.
Just a little note - I tried to pick up my two red aces right handed to reproduce the Malkovich photo, and it’s possible but relatively awkward. Is there a special poker code being displayed?