Epsilon Theory will occasionally publish academic research of merit pertaining to financial and political markets.
You can read about our reasons and our guidelines here: Why Publish Academic Research?
If you have publishable academic research that you think expands our collective understanding of financial or political markets, and you’d like to give it access to our network of 100,000+ investment professionals, asset owners, academics and market enthusiasts, please send it to us at [email protected].
Will making academic journals irrelevant save the world? No.
But it’s a good start.
PDF Download: Rebalance Timing Luck: The Dumb (Timing) Luck of Smart Beta
Authors
Corey Hoffstein is Chief Investment Officer at Newfound Research. 380 Washington Street 2nd Floor, Wellesley, MA 02481. E-mail: [email protected]. [1]
Nathan Faber is a vice president at Newfound Research. 380 Washington Street 2nd Floor, Wellesley, MA 02481. E-mail: [email protected].
Steven Braun is a quantitative analyst at Newfound Research. 380 Washington Street 2nd Floor, Wellesley, MA 02481. E-mail: [email protected].
Abstract
Prior research and empirical investment results have shown that portfolio construction choices related to rebalance schedules may have non-trivial impacts on realized performance. We construct long-only indices that provide exposures to popular U.S. equity factors (value, size, momentum, quality, and low volatility) and vary their rebalance schedules to isolate the effects of “rebalance timing luck.” Our constructed indices exhibit high levels of rebalance timing luck, often exceeding 100 basis points annualized, with total impact dependent upon the frequency of rebalancing, portfolio concentration, and the nature of the underlying strategy. As a case study, we replicate popular factor-based index funds and similarly find meaningful performance impacts due to rebalance timing luck. For example, a strategy replicating the S&P Enhanced Value index saw calendar year return differentials above 40% strictly due to the rebalance schedule implemented. Our results suggest substantial problems for analyzing any investment when the strategy, its peer group, or its benchmark is susceptible to performance impacts driven by the choice of rebalance schedule.
INTRODUCTION
The popularization and distribution of equity factor strategies has been a boon to investors, providing low-cost access to a range of systematic investment styles. However, there is no precise method of measuring or executing these strategies. Differences in the approaches to constructing these strategies can lead to significant dispersion in results even for strategies targeting the same investment style (Ciliberti and Gualdi (2018)). While substantial effort is spent researching new factor signals, refining previously discovered signals, and developing portfolio construction techniques, the seemingly innocuous activity of choosing when to rebalance these strategies is largely absent from the existing literature.
Blitz, van der Grient, and van Vliet (2010) first documented this impact for an annually-rebalanced fundamental equity index, finding a large discrepancy in realized results. This fundamental index, as described in Arnott, Hsu, and Moore (2005), weights its constituents in proportion to the companies’ fundamentals (book value, cash-flow, and dividends), in contrast to the conventional approach where the constituent weights are proportional to their market capitalization. Blitz et al (2010) documented that a fundamental index annually rebalanced in March outperformed an identically constructed index rebalanced in September by over 10 percentage points in 2009, despite the two indices being identical in process and rebalance frequency. Further, the authors found that the realized performance dispersion resulting from the different rebalance schedules [2] was not mean-reverting, generating a permanent remnant in the performance of the indices; an effect large enough to influence investment decisions long after the initial dispersion was manifested.
We label the potential performance dispersion between two identically managed strategies with different rebalance schedules rebalance timing luck (RTL). When applied to a single manager or fund, this concept is theoretical in that the effect lies in the investment decisions that could have been made (e.g. annually rebalancing in March rather than September). The realized performance of a fund cannot be changed and RTL can only be explicitly measured ex-post through the lens of a theoretical universe of identically-managed investment strategies with varied rebalance schedules. Importantly, the effects of RTL can also present itself when comparing a manager’s performance to another manager or even to a benchmark. Given different rebalance schedules, positive and negative RTL impacts can make a given manager appear more or less skilled. [3]
To illustrate these effects, we first construct long-only U.S. equity strategies designed to capture value, momentum, quality, and low volatility tilts, where the universe of eligible securities is obtained from the S&P 500 universe and fundamental data is obtained from Sharadar Fundamentals. For each style, we vary the target number of holdings as well as the rebalance frequency to target specific sensitivities to these explicit decisions. In line with the analytical derivation of RTL from Hoffstein, Sibears, and Faber (2019), we find that the realized RTL is directly influenced by the number of holdings, the portfolio turnover realized by the strategy, and the rebalance frequency. Our results also align with the expectation that strategies with low average turnover tend to exhibit less RTL.
To further illustrate the real-world effects of timing luck, we then replicate popular smart beta indices in the United States Large-Cap equity space. Our findings suggest that the choice of rebalance schedule is material and has affected annualized returns by as much as 200 basis points for higher turnover strategies, with one-year performance discrepancies as high as 40 percentage points.
Through the results in our study, we extend the literature by validating the existence of RTL in indices corresponding to popular equity investment styles. Further, by utilizing the framework identified in Hoffstein et al (2019), our results empirically validate the influence that portfolio concentration, portfolio turnover, and rebalance frequency choices have on the realized results of an investment strategy. By explicitly testing the RTL framework on different equity investment styles, we also show that the analytical derivation of RTL unveils significant insights for analyzing the realized performance of an investment strategy.
Our results suggest significant potential problems for return-based strategy comparisons and analysis. For example, failing to inoculate a benchmark against the effects of RTL can cause a strategy to appear skilled or un-skilled by relative comparison when the performance dispersion is actually an artifact of luck. This is a particularly timely topic given the popularization of “smart beta” strategies and other systematic funds over the last decade. Our results show that the spectre of RTL is an ongoing influence on portfolio results and the prioritization of portfolio construction, through the use of an overlapping portfolio solution, leads to more consistent outcomes for the end investor and successfully mitigates the unpalatable effects of RTL.
CONSTRUCTING EQUITY FACTOR PORTFOLIOS
We begin by constructing long-only, U.S. large-cap factor portfolios, using the S&P 500 as the parent universe. For each factor, securities are first ranked by corresponding characteristics and the top-ranking securities are purchased in equal weight. The characteristics defining our factor strategies are as follows: [4]
To estimate RTL for a given factor, we first construct sub-indexes reflecting the different potential rebalance schedules and then we use those sub-indexes to construct an RTL-neutral benchmark. For the latter, we follow the suggestion of Blitz et al (2010) – proved optimal by Hoffstein et al (2019) – and implement an “overlapping portfolio” solution (also referred to as “staggered rebalancing” or “tranching”) by holding the sub-indexes in equal weight.
By construction, the performance differences that occur between the sub-indexes and the RTL-neutral benchmark are due only to differences in rebalance schedule. Therefore, by calculating the differences in monthly returns between the sub-indexes and the RTL-neutral benchmark, we can empirically measure RTL. Specifically, we measure RTL as the annualized volatility of these differences.
Hoffstein et al (2019) derived an intuitive closed-form solution for an ex-ante estimate of RTL (Equation 1). From this equation, it becomes clear that RTL (L) is affected by a portfolio’s turnover rate (T), rebalance frequency (f), and the opportunity set allotted to the portfolio (S). [5]
A higher turnover rate implies that the holdings of a portfolio have a higher potential for meaningful divergence for different rebalance schedules. Consider a portfolio with 100% average annual turnover; it would follow that a portfolio such as this, with an annual rebalance schedule in January versus a portfolio rebalanced in July, would have a low level of holdings overlap, thus increasing the role of RTL in the two portfolios’ performance results. Conversely, a strategy with close to zero turnover would have a high level of holdings overlap between rebalance schedules, implying a lower amount of performance dispersion from RTL alone.
We should think of T as an intrinsic, continuous turnover rate of the strategy driven by the decay speed of the driving signals. In practice, however, portfolios are typically refreshed at a discrete frequency (f) to balance signal freshness with implementation costs. For faster moving signals (e.g. momentum which has a particularly short half-life as opposed to a slow signal such as value), the level of signal decay in between rebalance dates can introduce RTL into the portfolio’s performance as the signal begins to decay, favoring more recent information.

With this in mind, we also construct a number of specifications for each factor by varying (1) the number of holdings and (2) the rebalance frequency. Portfolio holdings range between 50 and 400 securities in increments of 50. Rebalance frequency is either annual, semi-annual, or quarterly. [6]
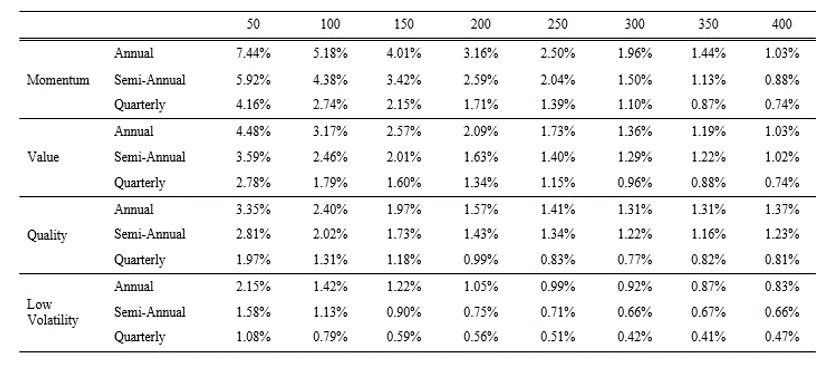
Exhibit 1 depicts the calculated RTL of the four factor portfolios for different concentration and rebalance frequency specifications. [7]
Exhibit 1
In this table, we show the empirical estimate of timing luck of Value, Momentum, Quality, and Low Volatility U.S. Large Cap equity factor portfolios for annual, semi-annual, and quarterly rebalance frequencies, varied by the number of holdings in the portfolio. The Momentum portfolio is constructed by sorting on 12-1 month realized returns; the Value portfolio is constructed by sorting on trailing twelve-month earnings yield; the Quality portfolio is constructed by sorting on the average rank of trailing twelve-month return on equity, accruals ratio (negative), and leverage ratio (negative); the Low Volatility portfolio is constructed by sorting on trailing twelve-month realized volatility (negative). The time-period for these results is July 2000 to September 2019.
Source: Sharadar. Past performance is not an indicator of future results. Performance is backtested and hypothetical. Performance figures are gross of all fees, including, but not limited to, manager fees, transaction costs, and taxes. Performance assumes the reinvestment of all distributions.
In line with Equation 1, the empirical results show that higher turnover styles, such as momentum, exhibit higher realized RTL as opposed to lower turnover styles such as low volatility. Further, higher portfolio concentration (i.e. fewer holdings) increases the magnitude of RTL as more concentrated portfolios would reduce the level of holdings overlap between rebalance versions, while more frequent rebalancing tends to reduce it. Surprising, however, is the actual magnitude of RTL; for a semi-annual rebalance schedule, annualized RTL is as high as 2.5%, 4.4%, 1.1% and 2.0% for 100-stock value, momentum, low volatility, and quality portfolios, respectively.
A portfolio that takes a long position in one of these sub-portfolios while being short another, could then explicitly capture the relative effect of timing luck between the two portfolios. If we assume that the impacts of RTL are independent from one another, we can calculate the volatility of this long-short portfolio through Equation 2, where vi and vj are the different sub-portfolios of the same strategy. From this, a confidence level can be generated to capture the potential return range that a strategy would be expected to achieve, simply from the rebalance choices the strategy had made. For the 100-stock value, momentum, low-volatility, and quality portfolios, we could, therefore, infer that a strategy targeting one of these styles could have resulted in performance dispersions of +/- 7.1, 12.5, 3.1, and 5.7 annual percentage points due to RTL alone.

These results complicate the manager selection process as the annual returns of two managers tilting towards the same style could be several hundred basis points apart strictly due to different rebalance schedules and nothing else. Conversely, the skill of a manager may appear diminished (inflated) when compared to a benchmark that realized positive (negative) RTL.
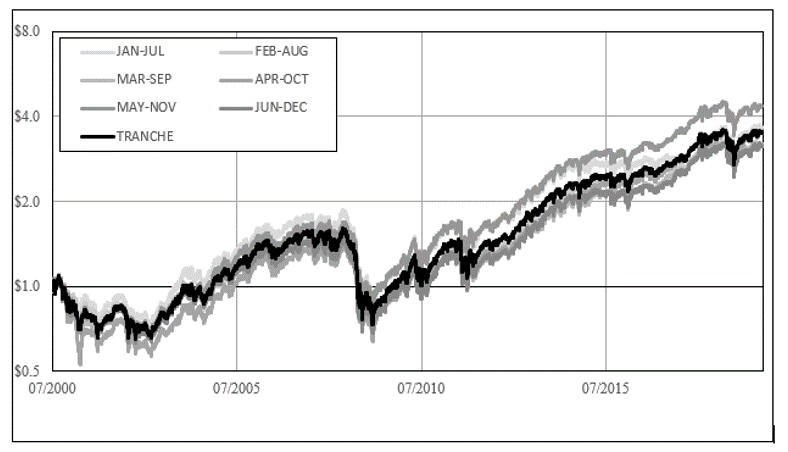
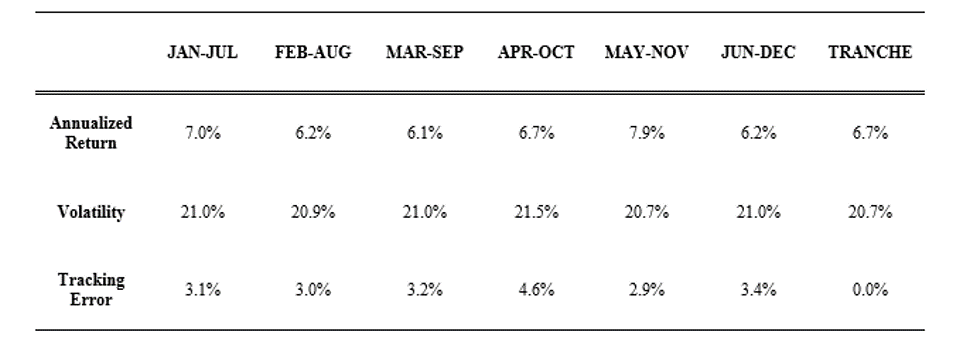
To highlight the effects of dispersion caused by RTL, Exhibit 2 depicts the various equity curves of the sub-indexes for a semi-annually rebalanced, 100-stock momentum strategy. We also construct the RTL-neutral benchmark (labeled “Tranche”). Exhibit 3 details the realized performance statistics of the sub-indices as well as their tracking error to the RTL-neutral benchmark. We find that the minimum tracking error realized is 2.9%, which happens to also arise from the best-performing rebalance schedule over the analysis period (MAY-NOV), while the greatest tracking error realized over this period is 4.6%.
While the sub-index rebalanced in May and November had the highest realized returns, the performance difference is not statistically significant and suggests that the realized excess performance of this parameterization is not persistent. Rather, the May and November rebalance schedule simply benefited from positive RTL shocks relative to its peers.
Exhibit 2
In this figure, we show the equity curves of 100-stock equity momentum portfolios constructed from the S&P 500 universe. These portfolios depict the different rebalance schedules of a semi-annual rebalance frequency. The tranched portfolio is also shown which represents a composite of the different rebalance schedules.
Source: Sharadar. Past performance is not an indicator of future results. Performance is backtested and hypothetical. Performance figures are gross of all fees, including, but not limited to, manager fees, transaction costs, and taxes. Performance assumes the reinvestment of all distributions.
Exhibit 3
In this table, we show the annualized performance statistics of the six rebalance schedules available to a semi-annually rebalanced equity momentum portfolio sorted on 12-1 month realized returns, as well as the tranched composite of these rebalance schedules. Tracking error is calculated relative to the tranched composite.
Constructing portfolios that are long one sub-index and short another for all iterations isolates the relative RTL between the two sub-indices. We find that the overall significance of any persistent outperformance is low, indicating that no rebalance schedule shows significant outperformance over other versions of the strategy. Out of the fifteen permutations of the momentum style, no combinations were found to be statistically significant,[8] and similar results were found in the remaining styles (pairwise t-stat tables can be found in Appendix A).
Importantly, this test of significance serves the purpose of disproving whether there exists a rebalance schedule that is inherently superior versus the others. The lack of evidence for schedule superiority suggests that RTL is an uncompensated source of risk in portfolio construction. The manner in which this risk manifests is in the dispersion of terminal wealth achieved, and the RTL shocks that lead to this dispersion not expected to have mean-reverting characteristics, as shown in Blitz et al (2010).
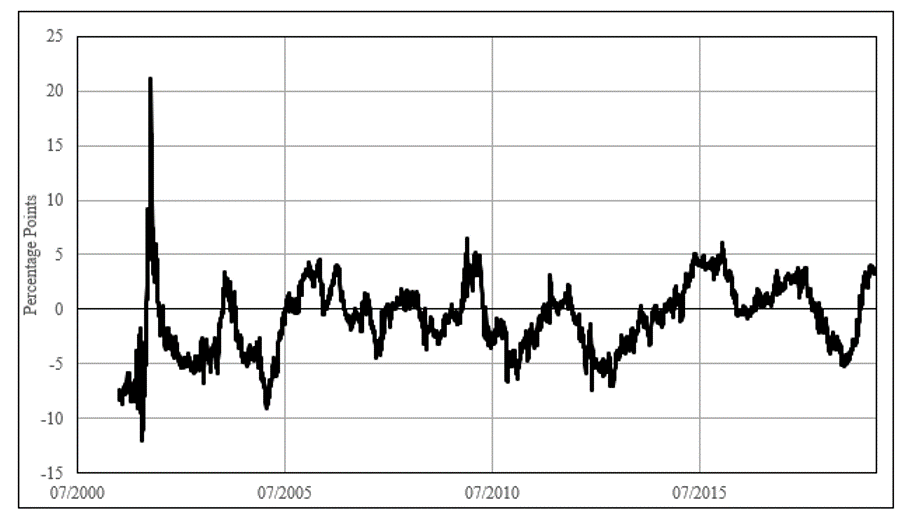
To further isolate the dispersion due to RTL, Exhibit 4 plots the rolling 252-day performance difference between two different rebalance schedules for a semi-annually rebalanced 100-stock momentum strategy. Shockingly, the seemingly trivial decision to rebalance the portfolio in May and November resulted in a twenty percentage-point return difference when measured against the same strategy, with its rebalance shifted by only one month (April and October).
Exhibit 4
In this figure, we show the rolling 252-day performance difference between a 100-stock momentum portfolio rebalanced in May/November and a 100-stock momentum portfolio rebalanced in April/October.
Source: Sharadar. Past performance is not an indicator of future results. Performance is backtested and hypothetical. Performance figures are gross of all fees, including, but not limited to, manager fees, transaction costs, and taxes. Performance assumes the reinvestment of all distributions.
REPLICATING EXISTING SMART BETA PRODUCTS
To bridge the gap from hypothetical to use-case, we replicate the process behind the S&P 500 Enhanced Value, Momentum, Low Volatility, and Quality indices. Specifically, we implement the rules disclosed in the index methodology as follows:[9]
Building from these rules, we construct all possible rebalance schedule variations of these four indexes.[10] Exhibit 5 highlights the terminal wealth realized from the portfolios along with the best and worst performing rebalance schedules. The resulting portfolios are shown to exhibit significant amounts of performance dispersion, flowing through to meaningful differences in the terminal wealth accumulated. Again, it is important to emphasize that the only difference in these portfolios is the rebalance schedule: all other aspects of the portfolio construction process are held constant.
Exhibit 5
In this figure, we show the terminal wealth results from a one-dollar investment in different replicated S&P equity factor index variations from January 2001 to September 2019.
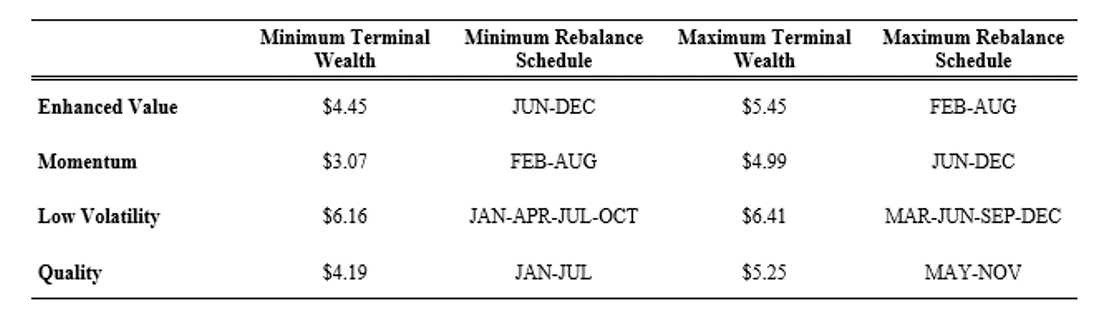
For the Enhanced Value, Momentum, Low Volatility, and Quality indices, the annualized return dispersion between the best- and worst-performing rebalance schedules is 100, 192, 25, and 106 basis points, respectively. Importantly, a pattern does not exist as to which rebalance schedule shows consistent under- or out-performance between factors.
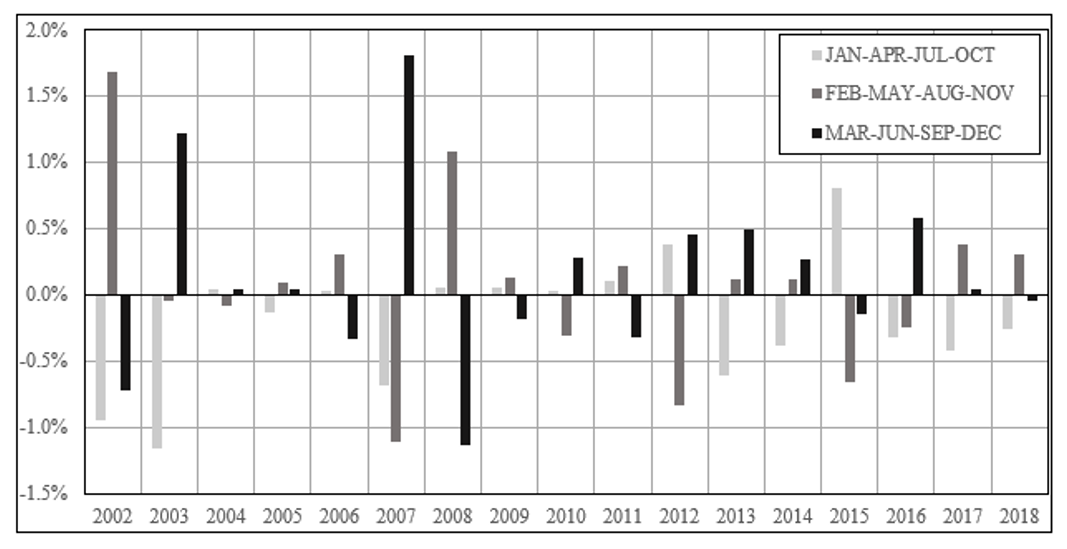
Exhibits 6, 7, 8, and 9 plot the calendar year returns in excess of the average sub-portfolio return for that year, for different rebalance schedules. The annual returns of the factors highlight that periods of elevated market volatility can exacerbate performance dispersion. The S&P 500 Enhanced Value replications, for example, see a highly significant dispersion arising in 2009, whereby the indices rebalanced in FEB-AUG and JAN-JUL significantly outperformed the other versions. Between the JAN-JUL and JUN-DEC rebalance schedules, the performance differential in 2009 is an astounding 41.7 percentage points.
Exhibit 6
In this figure, we show the calendar year excess returns of the replicated S&P 500 Enhanced Value index relative to the average sub-portfolio calendar year return, varied by rebalance schedule.
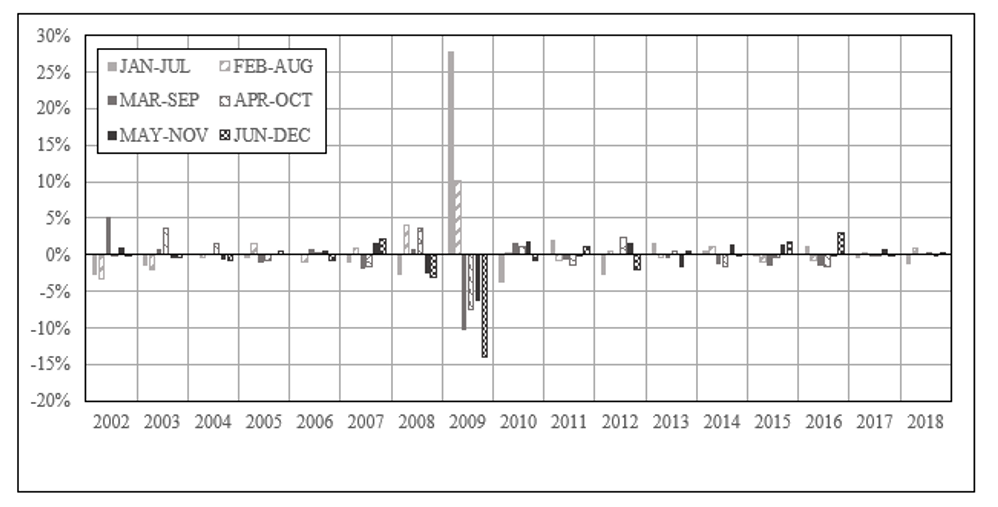
Source: Sharadar. Past performance is not an indicator of future results. Performance is backtested and hypothetical. Performance figures are gross of all fees, including, but not limited to, manager fees, transaction costs, and taxes. Performance assumes the reinvestment of all distributions.
Exhibit 7
In this figure, we show the calendar year excess returns of the replicated S&P 500 Momentum index relative to the average sub-portfolio calendar year return varied by rebalance schedule.
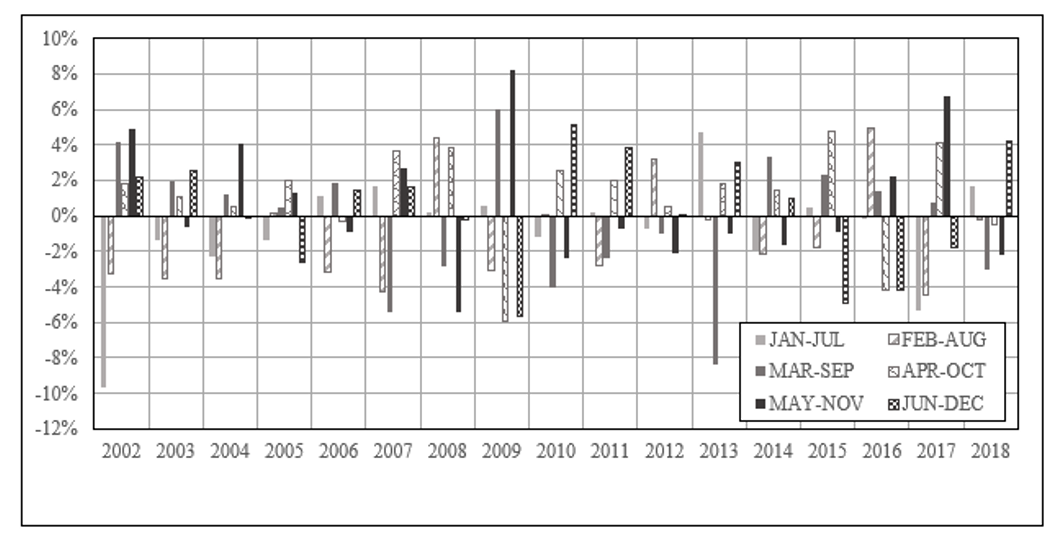
Source: Sharadar. Past performance is not an indicator of future results. Performance is backtested and hypothetical. Performance figures are gross of all fees, including, but not limited to, manager fees, transaction costs, and taxes. Performance assumes the reinvestment of all distributions.
Exhibit 8
In this figure, we show the calendar year excess returns of the replicated S&P 500 High Quality index relative to the average sub-portfolio calendar year return, varied by rebalance schedule.
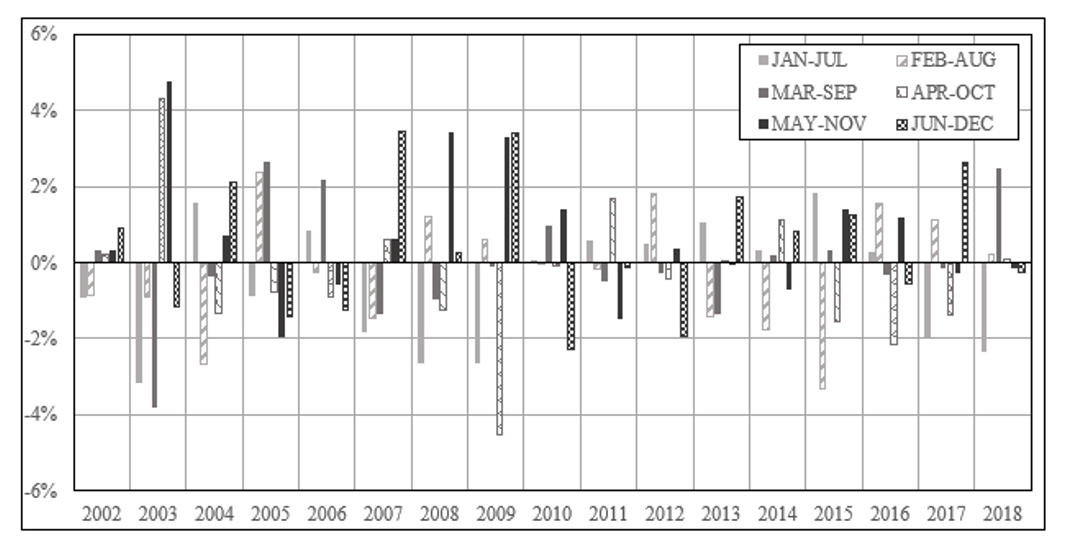
Source: Sharadar. Past performance is not an indicator of future results. Performance is backtested and hypothetical. Performance figures are gross of all fees, including, but not limited to, manager fees, transaction costs, and taxes. Performance assumes the reinvestment of all distributions.
Exhibit 9
In this figure, we show the calendar year excess returns of the replicated S&P 500 Low Volatility index relative to the average sub-portfolio calendar year return, varied by rebalance schedule.
Source: Sharadar. Past performance is not an indicator of future results. Performance is backtested and hypothetical. Performance figures are gross of all fees, including, but not limited to, manager fees, transaction costs, and taxes. Performance assumes the reinvestment of all distributions.
The S&P 500 Momentum replications show that the overall dispersion in performance throughout the period analyzed tends to be more consistent, given that the turnover of this strategy tends to remain high, as the majority of the years realize a difference of at least four percentage points.[11] For each of the factor replication strategies, minimum annual performance dispersion, as measured by absolute difference in calendar year returns, are 1.3, 4.5, 1.8, and 0.1 percentage points for Enhanced Value, Momentum, Quality, and Low Volatility, respectively. The maximum return differences were 41.7, 14.6, 8.6, and 2.9 percentage points, respectively. Elevated bouts of broad market volatility tend to increase the amounts of absolute dispersion (e.g. 14.6 percentage points in 2002 and 14.1 percentage points in 2009).
CONCLUSION
While the concept and execution of rebalance schedules has been glossed over in the existing literature, a decision must be made as to when a strategy is measured and executed. This decision does not come without consequence. Empirical evidence has shown that performance results can vary drastically and leave a lasting impact on wealth outcomes.
In this piece, we explored the impact of rebalance timing luck on the results of smart beta / equity style portfolios with varying portfolio characteristics. We empirically tested this impact by designing a variety of portfolio specifications for four different equity styles (Value, Momentum, Low Volatility, and Quality). The specifications were varied by holding concentration as well as rebalance frequency.
We then constructed all possible rebalance variations of each specification to calculate the realized impact of rebalance timing luck over the test period (2001-2019). In line with the mathematical model from Hoffstein et al (2019), we generally find that those strategies with higher turnover are more sensitive to timing luck, while those that rebalance more frequently exhibit less timing luck. Additionally, a higher number of portfolio holdings reduces the impact timing luck has on realized returns, all else equal.
The sheer magnitude of timing luck, however, may come as a surprise to many. For reasonably concentrated portfolios (100 stocks) with semi-annual rebalance frequencies (common in many index definitions), annual timing luck ranged from 1-to-4%, which translated to a 95% confidence interval in annual performance dispersion ranging from +/-1.5% per year for low turnover strategies to +/-12.5% for higher turnover strategies, though, we identify periods in which this estimate falls drastically short of empirical results.
These results call into question one’s ability to draw meaningful relative performance conclusions between two strategies, or a strategy and its benchmark, even if other variables such as factor definition and portfolio constructions methods are controlled.
We then explored more concrete examples, replicating the S&P 500 Enhanced Value, Momentum, Low Volatility, and Quality indices, which are tracked by live assets. In line with expectations, we find that Momentum (a high turnover strategy) exhibits significantly higher realized timing luck than a lower turnover strategy rebalanced more frequently (e.g. Low Volatility). For these four indices, the amount of rebalance timing luck leads to a staggering level of dispersion in realized terminal wealth.
Given that most of the major equity style benchmarks are managed with annual or semi-annual rebalance schedules, even the benchmarks that investors use for comparison and analysis may be realizing hundreds of basis points of positive or negative performance luck a year. While identifying and testing the impacts of RTL in a systematically managed strategy is certainly feasible, conducting the same exercise with a discretionary, actively managed strategy becomes non-trivial. Given that an active manager would not necessarily operate on a set rebalancing schedule, one might argue that timing is an active decision within an active manager’s process. Nevertheless, while difficult to explicitly measure, the specter of RTL would still play an important role in the manager’s result and therefore comparison against an RTL-neutral benchmark would be prudent. With such a large emphasis on identifying and quantifying the skill of investment managers, investors should always bear in mind that supposed skill, seemingly beyond passive smart beta investing, might merely be attributable to dumb (timing) luck.
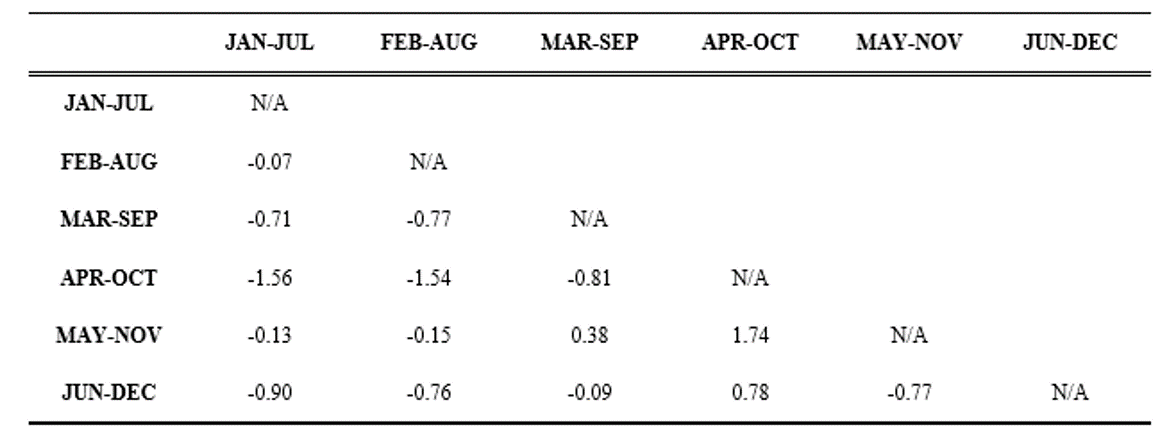
Appendix A
This appendix shows the t-statistics of the annualized realized returns of long-short portfolios for each equity style. The portfolios are constructed by creating a portfolio that is long one rebalance schedule and short another from January 2001 to September 2019. The t-stats depicted in these tables show the significance of average outperformance of the rebalance schedules, where the existence of statistically significant results would indicate the existence of a superior rebalance schedule over a long timeframe. Bolded values indicate statistical significance at the 5% level.
Pairwise t-stat table of constructed Long-Short Value portfolios of different rebalance dates. 5% statistical significance is indicated in bold.
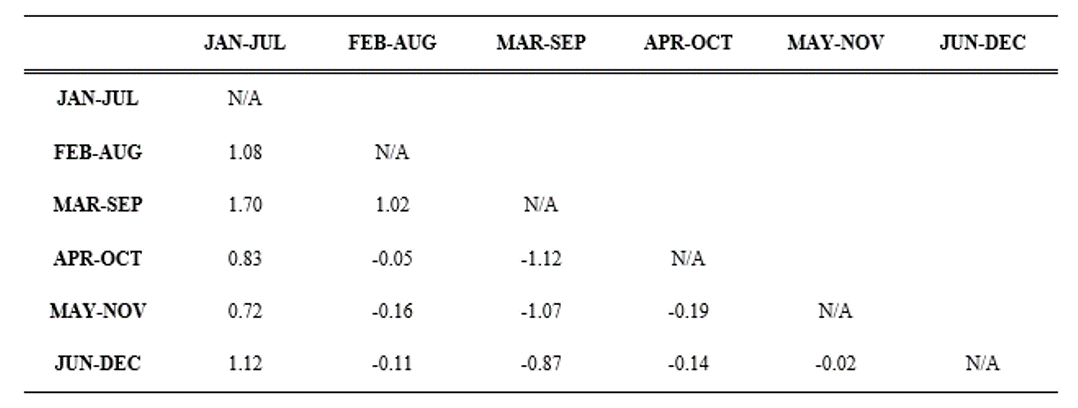
Pairwise t-stat table of constructed Long-Short Momentum portfolios of different rebalance dates. 5% statistical significance is indicated in bold.
Pairwise t-stat table of constructed Long-Short Quality portfolios of different rebalance dates. 5% statistical significance is indicated in bold.

Pairwise t-stat table of constructed Long-Short Low-Volatility portfolios of different rebalance dates. 5% statistical significance is indicated in bold.

References
Arnott, R.D., Hsu, J., and Moore, P. (2005), “Fundamental Indexation”, Financial Analysts Journal, Vol. 61, No. 2, 83-89.
Blitz, D., van der Grient, B., and van Vliet, P. (2010). “Fundamental Indexation: Rebalancing Assumptions and Performance,” Journal of Index Investing, Vol. 1, No. 2, 82-88.
Ciliberti, S., and Gualdi, S. “Portfolio Construction Matters.” arXiv.org, October 19, 2018. https://arxiv.org/abs/1810.08384.
Doran, J., Jiang, D., and Peterson, D. (2012). “Gambling Preference and the New Year Effect of Assets with Lottery Features,” Review of Finance, Vol. 16, No. 3, 685-731.
Haugen, R., and Lakonishok, J. (1988). “The Incredible January Effect: the Stock Markets Unsolved Mystery”. Homewood Ill.: Dow Jones-Irwin.
Hoffstein, C., Faber, N., Sibears, D. (2019). “Rebalance Timing Luck: The Difference Between Hired and Fired,” Journal of Index Investing, Vol. 10, No. 1, 27-36.
Keim, D. (1983). “Size Related Anomalies and Stock Return Seasonalities,” Journal of Financial Economics, Vol. 12, No. 1, 13-32.
Sias, R. (2007). “Causes and Seasonality of Momentum Profits.” Financial Analysts Journal, Vol. 63, No. 2, 48-54.
Notes
[1] The authors would like to thank (in alphabetical order) Adam Butler, David Cantor, Conrad Ciccotello, Antti Ilmanen, and Pim van Vliet who offered their opinions and insights.
[2] Herein we distinguish between rebalance frequency (e.g. semi-annual or annual) and rebalance schedule (e.g. every June and December or each May). The frequency defines how often the strategy is rebalanced while the schedule determines when, specifically, the rebalances occur within a year.
[3] When analyzing active portfolio managers, it is important to highlight that there is no evidence that managers make deliberate rebalance choices with the objective of maximizing performance, so any rebalance choice from actively managed portfolios is an active decision with unmeasured risk.
[4] The characteristics chosen to construct our factor portfolios were selected as these definitions generally align with the existing literature and popular indices tracking each style. These characteristics are meant to be representative only, but our research suggests they are without loss of generality.
[5] The S variable in Equation 1 is technically the estimated volatility of a long/short portfolio where the long leg of the portfolio is what the portfolio is invested in and the short leg captures the residual assets that the portfolio could be invested in at a given time. See Hoffstein et al (2019) for a further discussion of this variable.
[6] Data comes from Sharadar and utilizes all available pricing history at the timing of writing (2001 to 2019).
[7] All return results presented are gross of transaction fees or advisory expenses, so any increases in portfolio turnover from more frequent rebalances would negatively influence net returns, all else equal.
[8] There is existing literature citing a seasonality effect in momentum profits, known as the “January Effect”. This anomaly is credited to window-dressing (managers removing losing holdings from a portfolio before holdings are released at year-end), liquidity conditions in the market, higher investor risk appetites, as well as from tax-loss selling of underperforming stocks. The January Effect has been shown to boost common factor strategies returns in January, while impairing the returns of momentum strategies. Conversely, this effect originates in December, where institutional buying of recent winners pushes momentum profits higher in the month of December. See Keim (1983); Haugen, Lakonishok (1988), Sias (2007), and Doran, Jiang, Peterson (2009) for further descriptions and evidence of this phenomenon.
In the scope of this study, we found the results of the MAY-NOV (rebalanced and remeasured at month-end in May and November) momentum strategies to outperform other rebalance schedules; however, when analyzed through the lens of long-short portfolios, no combinations were found to be significant. Further, by instantiating simulation-based analysis of significance, there were no pairings that resulted in returns that were statistically dissimilar from zero.
[9] These methodologies were referenced from the S&P Dow Jones Indices website in December 2019.
[10] For indices with semi-annual rebalance schedules, there are six unique sub-indices that can be constructed, while there are three sub-indices available for an index that rebalances quarterly.
[11] The factor replication minimum performance dispersion, as measured by absolute difference in calendar year returns, are 1.3, 4.5, 1.8, and 0.1 percentage points for Enhanced Value, Momentum, Quality, and Low Volatility, respectively. The maximum return differences were 41.7, 14.6, 8.6, and 2.9 percentage points.
PDF Download: Rebalance Timing Luck: The Dumb (Timing) Luck of Smart Beta


Start the discussion at the Epsilon Theory Forum